
✨AUGUST Market Trends: Your Guide to Local Real Estate 📈
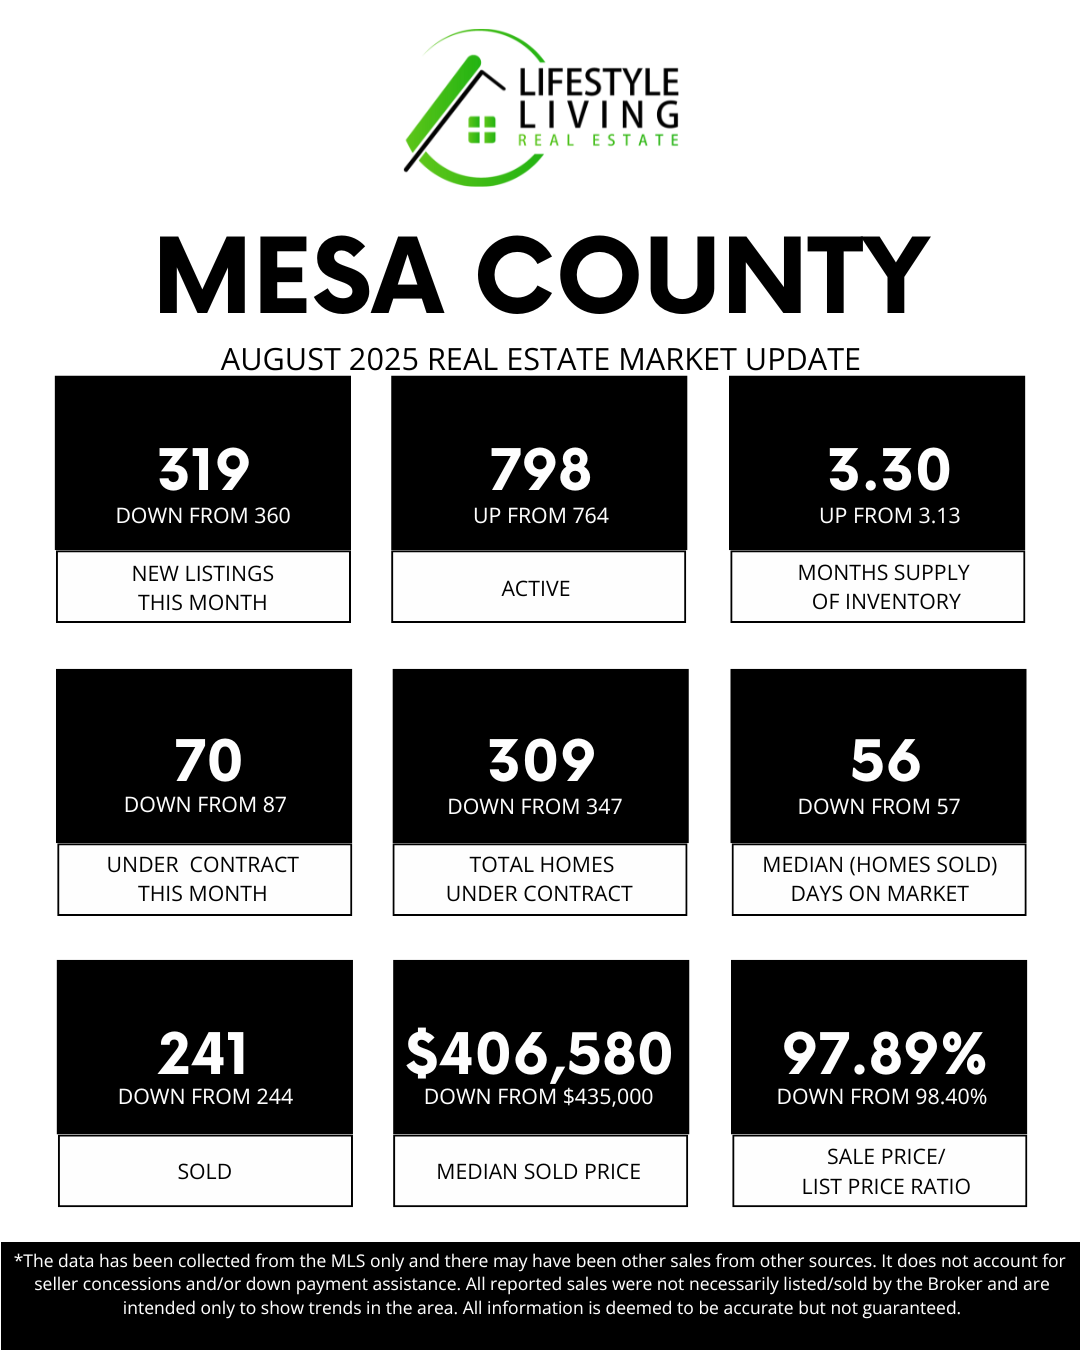
⬇️NEW LISTINGS IN AUGUST: 319, down from 360🏡
Fewer homes came on the market this August compared to last month, which means buyers had slightly less fresh inventory to choose from. This could be a sign that some sellers are waiting for fall before listing their homes.
⬆️TOTAL ACTIVE HOMES: 798, up from 764 📊
Despite fewer new listings, the total number of active homes increased. This suggests that homes are staying on the market longer or that demand has eased slightly.
⬆️MONTHS SUPPLY OF INVENTORY: 3.30, up from 3.13 📈
Inventory levels rose modestly, bringing us closer to a balanced market. A 4–6 month supply is generally considered balanced, so buyers are still facing competition, but conditions are slowly shifting.
⬇️UNDER CONTRACT IN AUGUST: 70, down from 87 📜
Fewer buyers went under contract last month, showing a slight dip in new activity. This is a reminder that while some buyers are slowing down, others are still moving forward when they find the right home.
⬇️TOTAL HOMES UNDER CONTRACT: 309, down from 347 🏠
The overall number of homes currently under contract is also down. This may indicate a more cautious buyer pool heading into fall.
⬇️MEDIAN (HOMES SOLD) DAYS ON MARKET: 56, down from 57 ⏳
Even with shifting numbers, homes that sold last month went under contract just a bit faster. This indicates that well-priced, move-in-ready homes continue to attract buyers quickly.
⬇️SOLD IN AUGUST: 241, down from 244 🪧
Closed sales remained nearly the same compared to the prior month, with only a slight decrease. This steadiness indicates that many transactions already in progress have successfully reached the closing table.
⬇️MEDIAN SOLD PRICE $406,580, down from $435,000 📉
The median sold price slipped in August, giving buyers some additional leverage in negotiations. However, prices remain strong compared to long-term trends.
⬇️ SALE PRICE/LIST PRICE RATIO: 97.89%, down from 98.40% 📉
Sellers received slightly less of their asking price on average, indicating that buyers are negotiating more effectively. Pricing homes strategically is more important than ever in today’s market.
💰 Price Analysis:
🏡 Homes Sold Under $499,999: 171 sales
🏘️ Mid-Range Market ($500,000–$999,999): 65 sales
💲 Luxury Market ($1M+): 5 sales
Are you ready to explore your real estate options or have questions about these statistics? Let’s discuss how these numbers can impact your buying or selling strategy!😄 🌟