
📊February Market Trends: Your Guide to Local Real Estate🏡
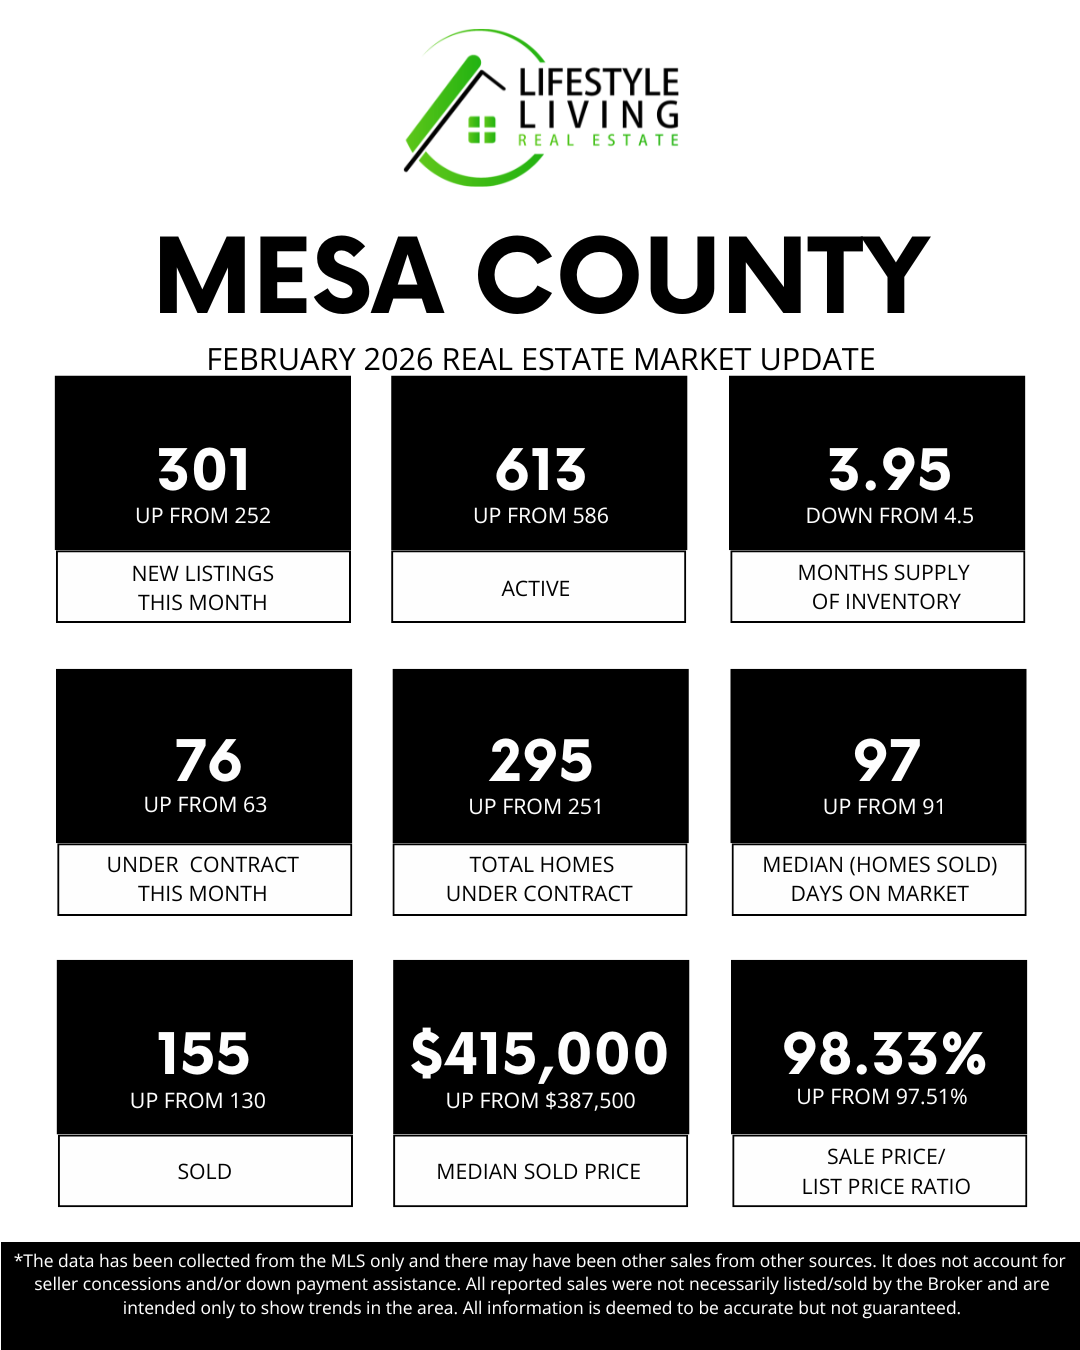
⬆️ NEW LISTINGS IN FEBRUARY: 301, up from 252 🏡
New listings continued to rise in February as more homeowners prepared for the upcoming spring market. This seasonal increase is common as sellers begin planning moves after the winter months. Buyers are seeing more fresh opportunities entering the market compared to the start of the year.
⬆️ TOTAL ACTIVE HOMES: 613, up from 585 📊
Active inventory grew slightly as new listings outpaced completed sales. This gives buyers more choices and a wider range of options across price points. The gradual increase signals a market slowly opening up as we transition toward spring activity.
⬇️ MONTHS SUPPLY OF INVENTORY: 3.95, down from 4.5 📉
Even with more homes available, stronger buyer activity reduced overall inventory supply. Demand is keeping pace with new listings, preventing inventory from building too quickly. The market remains competitive while moving toward a healthier balance.
⬆️ UNDER CONTRACT IN FEBRUARY: 76, up from 63 📜
More buyers went under contract in February, showing growing confidence as the year gains momentum. Improved affordability and seasonal optimism helped encourage buyers to move forward. This increase is often an early indicator of stronger spring sales ahead.
⬆️ TOTAL HOMES UNDER CONTRACT: 295, up from 251 🏠
Pending sales climbed as buyer activity continued to build month over month. A larger number of homes in escrow creates a solid pipeline for upcoming closings. This reflects steady engagement from buyers despite longer decision timelines.
⬆️ MEDIAN (HOMES SOLD) DAYS ON MARKET: 97, up from 91 ⏳
Homes are taking slightly longer to sell as buyers gain more options and take time to compare properties. With increased inventory, buyers are approaching decisions more thoughtfully. Proper pricing and strong presentation remain essential for sellers looking to stand out.
⬆️ SOLD IN FEBRUARY:155, down from 130 🪧
Closed sales increased from January, reflecting contracts written earlier in the year. This rise shows market activity beginning to rebound after the slower winter season. Momentum is gradually building as we move closer to spring.
⬆️ MEDIAN SOLD PRICE: $415,000, up from $387,500 📈
The median sold price rose noticeably, demonstrating continued strength in home values. Well-prepared and competitively priced homes continue to attract strong buyer interest. Price growth reflects steady demand even as the market becomes more balanced.
.
⬆️ SALE PRICE / LIST PRICE RATIO: 98.33%, up from 97.51 📈
Homes sold closer to their asking price on average, indicating stronger alignment between buyers and sellers. Competitive pricing strategies are helping sellers achieve solid results. This improvement suggests buyers remain motivated when homes are positioned correctly in the market.
💰 Sold Price Analysis
🏡 Homes Under $499,999: 111 sales
🏘️ Mid-Range Market ($500,000–$999,999): 40 sales
💲 Luxury Market ($1M+): 4 sales
Most activity remained concentrated in homes under $500,000, where affordability continues to drive demand. Mid-range sales remained steady, while luxury properties accounted for a smaller share of transactions. This distribution shows buyers remain value-conscious even as overall activity increases.
📊 February Market Summary
February’s numbers show early signs of the spring market taking shape, with increases in listings, pending contracts, closed sales, and home prices. Buyers are becoming more active, while expanded inventory gives them slightly more time to make decisions. Overall, Mesa County’s housing market is moving toward a more balanced and active environment as we head into the busy spring season.