
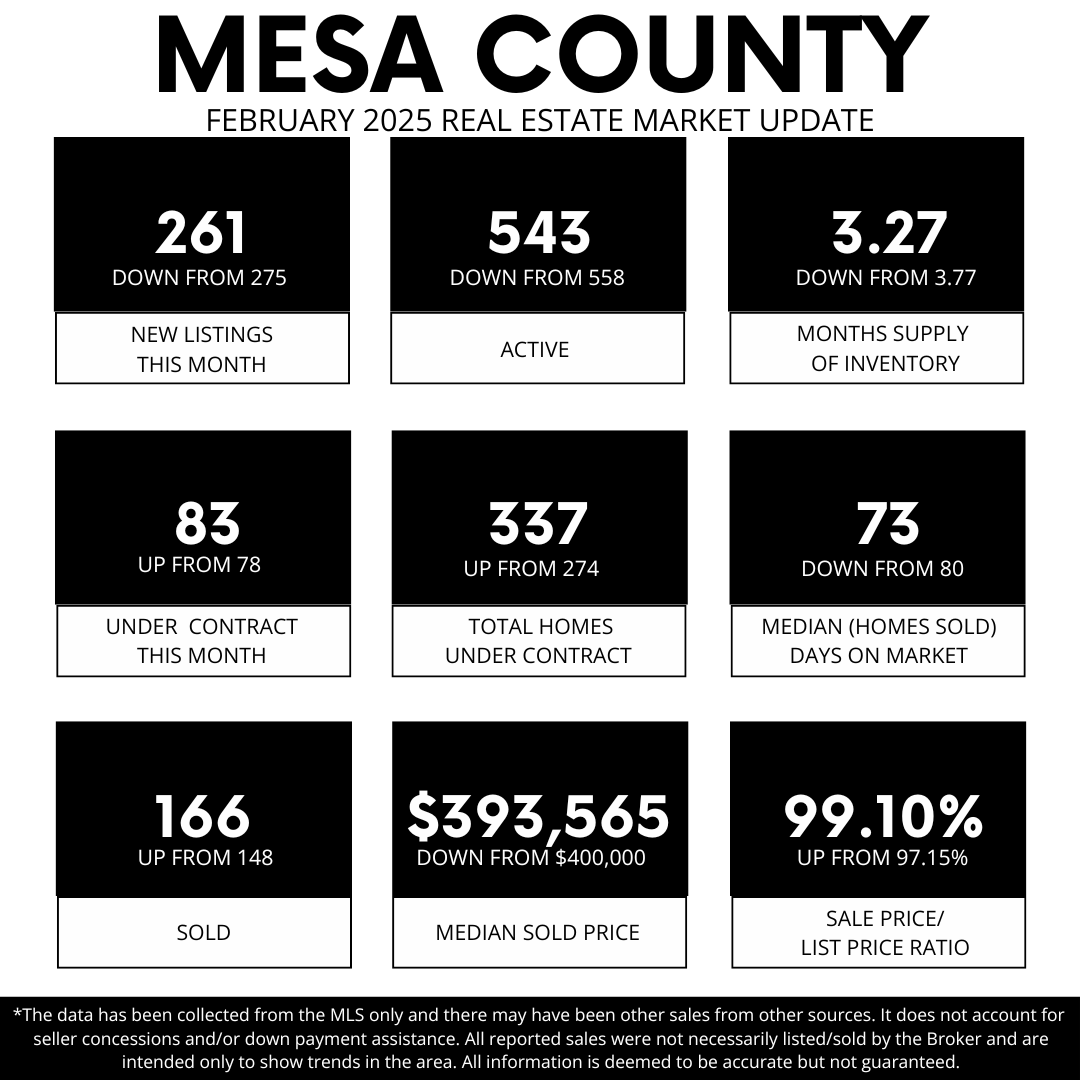
⬇️ NEW LISTINGS IN FEBRUARY: 261, down from 275 ❤️
Fewer homes were listed last month, signaling that sellers may still be waiting for the busy spring market. With inventory tightening, buyers may find fewer choices, making well-priced homes even more competitive.
⬇️TOTAL ACTIVE HOMES: 543, down from 558 🏡
The number of active listings continues to decline, reflecting a market where buyers are scooping up available homes faster than new ones are being listed. This can create a sense of urgency for buyers looking to lock in a home before the spring rush.
⬇️ MONTHS SUPPLY OF INVENTORY: 3.27, down from 3.77 📉
With inventory shrinking, the months of supply are also decreasing. A lower supply indicates a more competitive market for buyers, potentially leading to multiple-offer situations for well-presented homes.
⬆️ UNDER CONTRACT IN FEBRUARY: 83, up from 78 📜
More buyers secured homes last month, showing that demand remains strong despite limited inventory. This upward trend suggests that buyers are actively searching and making decisions sooner.
⬆️ TOTAL HOMES UNDER CONTRACT: 337, up from 274 🏠
This significant jump in pending sales highlights growing confidence in the market. Buyers are moving forward with purchases, anticipating more competition as spring approaches.
⬇️MEDIAN (HOMES SOLD) DAYS ON MARKET: 73, down from 80 🕒
Homes are selling slightly faster than last month, a sign that well-priced and well-prepared properties are attracting offers more quickly. This trend is expected to continue as buyer activity picks up.
⬆️SOLD IN FEBRUARY: 166, up from 148🪧
Sales activity increased, reinforcing the idea that buyers are getting off the sidelines and making moves before spring competition intensifies. More closed sales reflect steady demand in the market.
⬇️ MEDIAN SOLD PRICE: $393,564, down from $400,000 💵
The median sale price saw a slight dip, which could be due to more affordable homes selling or slight price adjustments to match market conditions. This presents an opportunity for buyers to secure a home before prices potentially rise again.
⬆️SALE PRICE/LIST PRICE RATIO: 99.10%, up from 97.15% 📈
Sellers are receiving offers closer to their asking price, showing that well-priced homes are attracting strong interest. This increase suggests that buyers are recognizing value and making competitive offers.
💰 Price Analysis:
🏡 Homes Sold Under $499,999: 121 sales
The majority of sales were in this price range, showing that demand remains strong for affordable and mid-priced homes. Buyers looking in this range should be prepared for competition, as these homes continue to move quickly.
🏘️ Mid-Range Market ($500,000–$999,999): 43 sales
This segment remains active, with buyers securing higher-end homes. Well-maintained properties with desirable features are attracting interest, especially as buyers seek more space and upgraded amenities.
💲 Luxury Market ($1M+): 2 sales
Luxury home sales were limited, reflecting a more selective market at higher price points. While this segment moves at a different pace, well-positioned luxury homes can still attract the right buyers looking for premium properties.
Are you ready to explore your real estate options or have questions about these statistics? Let’s discuss how these numbers can impact your buying or selling strategy!😄 🌟