
📊January Market Trends: Your Guide to Local Real Estate🏡
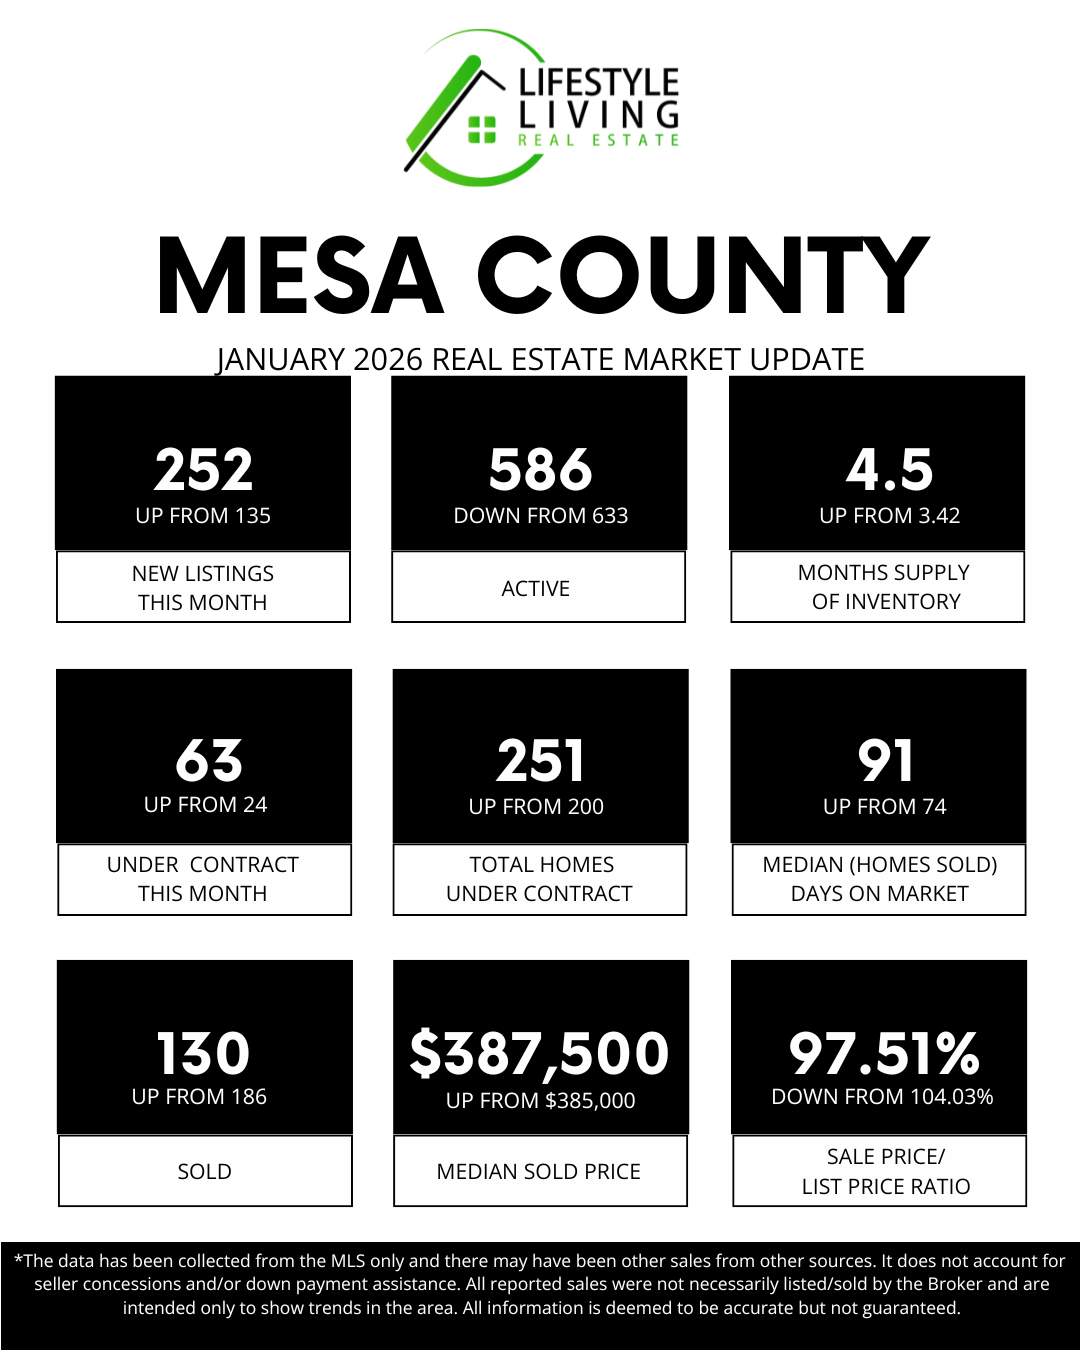
⬆️ NEW LISTINGS IN JANUARY: 252, up from 135 🏡
New listings increased significantly in January as more sellers entered the market after the holidays. This is a common seasonal pattern as homeowners kick off the new year with fresh plans. The increase gives buyers more options than in December.
⬇️ TOTAL ACTIVE HOMES: 586, down from 633 📊
Even with more new listings, total active inventory declined. This indicates that homes were being absorbed through sales, contracts, or seasonal expired listings. It shows buyer activity picking up enough to offset new inventory coming online.
⬆️ MONTHS SUPPLY OF INVENTORY: 4.5, up from 3.42 📈
Months of inventory increased in January, signaling a shift toward a more balanced market. With more listings coming on and homes taking longer to sell, buyers have gained a bit more breathing room. While this still isn’t an oversupplied market, it does encourage sellers to price and prepare their homes carefully.
⬆️ UNDER CONTRACT IN JANUARY: 63, up from 24 📜
Buyer activity increased noticeably in January, with more homes going under contract. This jump reflects buyers re-entering the market after the holidays. It’s a strong sign of renewed momentum heading into the spring season.
⬆️ TOTAL HOMES UNDER CONTRACT: 251, up from 200 🏠
The total number of homes under contract also rose, building a healthier pipeline of pending sales. This suggests continued buyer engagement beyond just new activity. These contracts will likely support future closed sales in the coming months.
⬆️ MEDIAN (HOMES SOLD) DAYS ON MARKET: 91, up from 74 ⏳
Homes took longer to sell in January, as is typical in winter and the holiday season. Well-priced and well-prepared homes still sold, but timelines stretched slightly.
⬇️ SOLD IN JANUARY: 130, down from 186 🪧
Closed sales declined, reflecting contracts written late in the year when activity was slower. Since closings lag behind contracts, this decrease aligns with December’s quieter market. With more homes now under contract, future sales numbers may improve.
⬆️ MEDIAN SOLD PRICE: $387,500, up from $385,000 📈
Despite fewer sales, prices remained stable with a slight increase in the median sold price. This suggests demand remains strong for well-located, well-maintained homes. Values are holding steady, even during the slower winter season
.
⬇️ SALE PRICE / LIST PRICE RATIO: 97.51%, down from 104.03% 📉
Homes sold slightly below list price on average, a shift from last month’s aggressive pricing. This reflects a more balanced negotiation environment. Buyers have a bit more room, while sellers need to price strategically.
💰 Sold Price Analysis
🏡 Homes Under $499,999: 94 sales
🏘️ Mid-Range Market ($500,000–$999,999): 33 sales
💲 Luxury Market ($1M+): 3 sales
Most activity continued in the more affordable price ranges, where buyer demand remains strongest. Mid-range and luxury homes saw fewer sales, which is typical during winter months. This distribution highlights the continued importance of affordability in today’s market.
📊 January Market Summary
January showed a clear re-engagement from both buyers and sellers after the holidays. New listings and contracts increased, inventory tightened slightly, and prices held steady, even as winter slowed overall sales volume. As we move toward spring, these trends suggest growing momentum and a market that is actively positioning itself for the months ahead.