
📊 March Market Trends: Your Guide to Local Real Estate 🏡
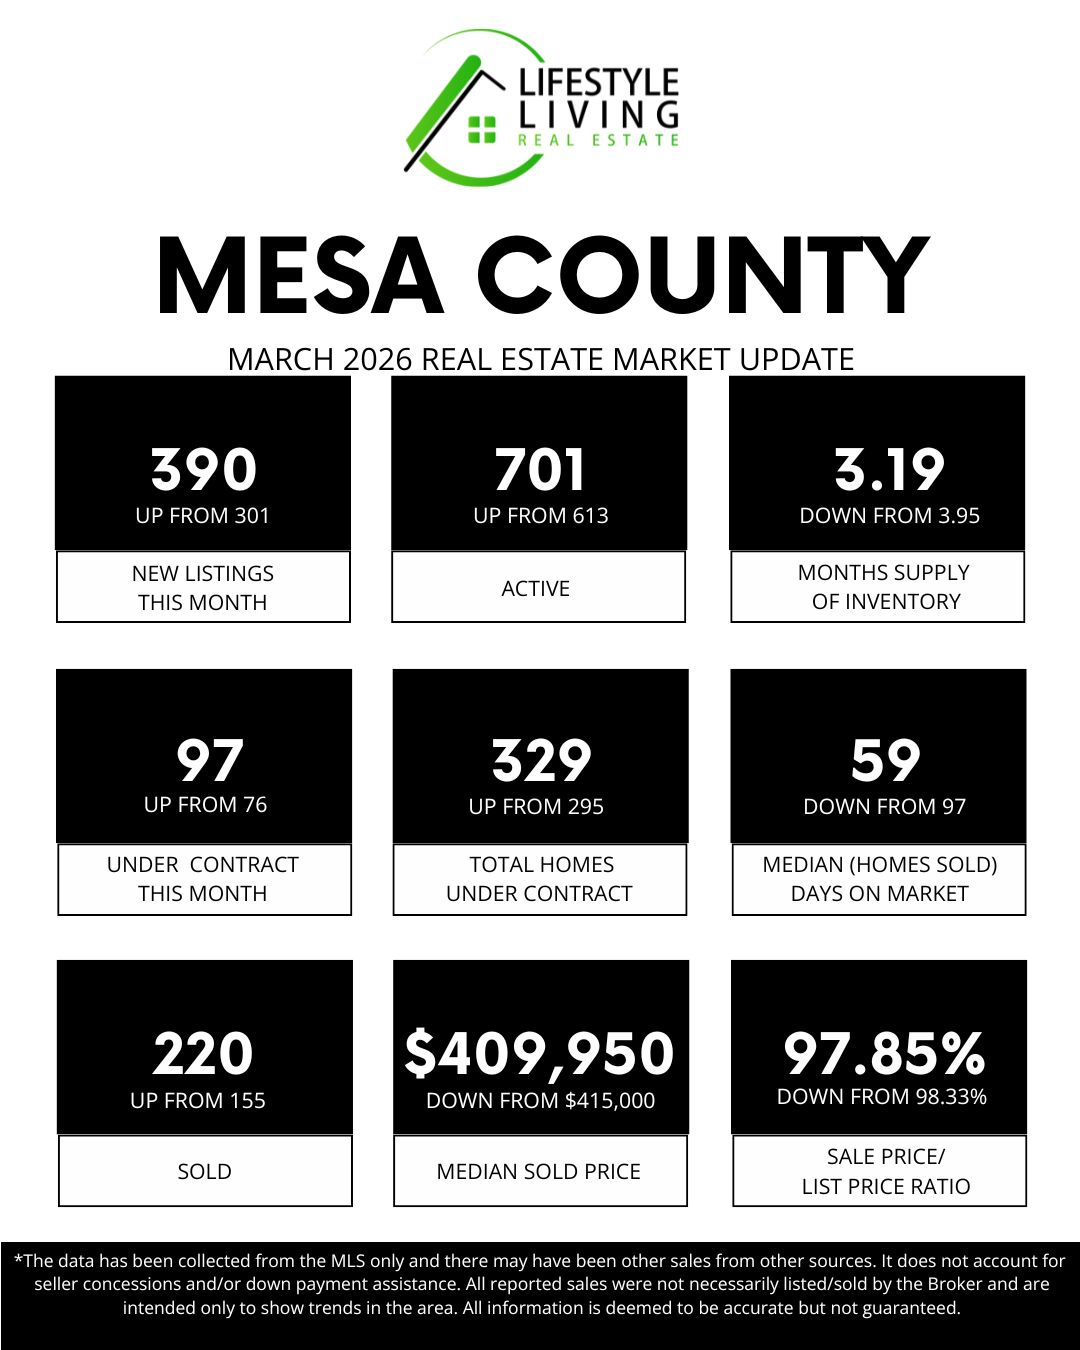
⬆️ NEW LISTINGS IN MARCH: 390, up from 301 🏡
New listings increased in March, which is typical as we move into the spring market. Many homeowners choose this time of year to list, which brings more options for buyers. This seasonal rise reflects the start of peak real estate activity.
⬆️ TOTAL ACTIVE HOMES: 701, up from 613 📊
Active inventory also increased as more homes came onto the market. Buyers are seeing a wider selection across different price points. This is a normal part of the spring market as inventory begins to build.
⬇️ MONTHS SUPPLY OF INVENTORY: 3.19, down from 3.95 📉
Even with more homes available, strong buyer activity reduced the overall supply. Homes are selling quickly enough to prevent inventory from piling up. This shows demand is keeping pace with the increase in listings.
⬆️ UNDER CONTRACT IN MARCH: 97, up from 76 📜
More homes went under contract, showing buyers are actively making decisions. As more options become available, buyers are finding homes that meet their needs. This is a key sign of a healthy, active market.
⬆️ TOTAL HOMES UNDER CONTRACT: 329, up from 295 🏠
The number of homes under contract increased, creating a strong pipeline for future closings. This reflects continued buyer engagement as we move into spring. It also supports the increase we’re seeing in closed sales.
⬇️ MEDIAN (HOMES SOLD) DAYS ON MARKET: 59, down from 97 ⏳
Homes sold significantly faster in March compared to February. With more buyers in the market, well-priced homes are moving quickly. This is a typical shift as the spring season gains momentum.
⬆️ SOLD IN MARCH: 220, up from 155 🪧
Closed sales increased, showing strong follow-through from earlier buyer activity. More contracts are successfully reaching the closing table. This reflects growing confidence and momentum in the market.
⬇️ MEDIAN SOLD PRICE: $409,950, down from $415,000 📉
The median price dipped slightly, which can happen as more inventory enters the market. A wider range of homes at different price points can influence the median. Overall, pricing remains stable and consistent with a healthy market.
⬇️ SALE PRICE / LIST PRICE RATIO: 97.85%, down from 98.33% 📉
Homes sold just slightly below the asking price on average. With more choices available, buyers have a bit more room to negotiate. This is a normal adjustment as the market becomes more balanced.
💰 Sold Price Analysis
🏡 Homes Under $499,999: 159 sales
🏘️ Mid-Range Market ($500,000–$999,999): 51 sales
💲 Luxury Market ($1M+): 10 sales
Most activity remained in the under $500,000 price range, where demand continues to be strongest. Mid-range and luxury homes also saw increased activity this month. This shows buyers are active across multiple price points as the market picks up.
📊 March Market Summary
March reflects a strong start to the spring market, with increases in listings, buyer activity, and closed sales. Homes are selling faster, and demand is keeping pace with the growing inventory. Overall, the market is becoming more active and balanced, creating opportunities for both buyers and sellers.