
✨MAY Market Trends: Your Guide to Local Real Estate 📈
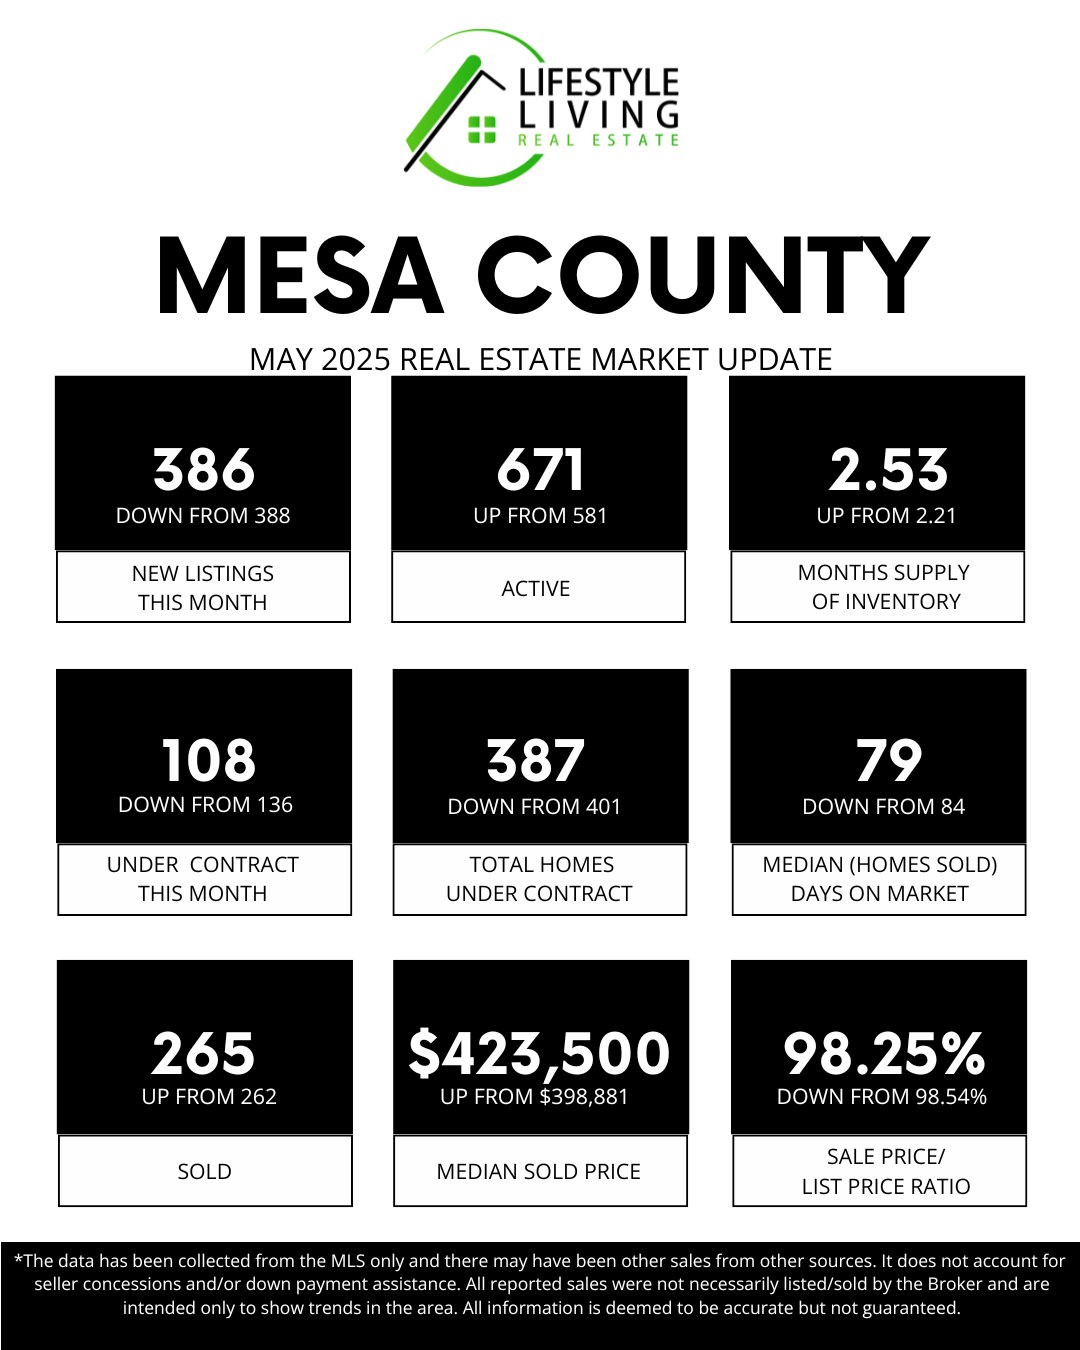
⬇️NEW LISTINGS IN MAY: 386, down from 388🏡
New listings held steady in May, with just two fewer homes coming on the market than in April. This signals consistency in seller activity heading into summer, but not a significant push of new inventory. Buyers are seeing a predictable flow of options rather than a surge.
⬆️ TOTAL ACTIVE HOMES: 671, up from 581 📊
Active listings jumped significantly, adding 90 more homes to the market. This increase provides buyers with more choices and suggests that some momentum is building among sellers. A growing inventory could help balance the market as summer progresses.
⬆️MONTHS SUPPLY OF INVENTORY: 2.53, up from 2.21 📉
We saw an increase in supply this month, now sitting at 2.53 months. This is a positive sign for buyers, showing that inventory is improving. However, we’re still in a seller's market, so competitive pricing and preparation remain essential for sellers.
⬇️UNDER CONTRACT IN MAY: 108, down from 136 📜
This is a sharper-than-expected drop for this time of year. May is typically a high-activity month, so seeing fewer homes go under contract suggests that elevated interest rates or affordability concerns may be weighing on buyers. While demand hasn't disappeared, the hesitation is noticeable—and it’s creating opportunities for serious buyers to negotiate without as much competition.
⬇️TOTAL HOMES UNDER CONTRACT: 387, down from 401 🏠
Pending sales dropped again this month, continuing a modest downward trend. This could result in slightly fewer closings in early summer, though activity typically picks up mid-season.
⬇️MEDIAN (HOMES SOLD) DAYS ON MARKET: 79, down from 84 ⏳
ATTENTION SELLERS...Despite the dip in new contracts, homes are still moving faster than they were a month ago. The five-day drop in market time reflects demand for well-priced and well-presented homes.
⬆️SOLD IN MAY: 265, up from 262 🪧
Closed sales rose slightly, but that slight increase doesn’t tell the whole story. We've seen more homes go under contract and then come back on the market, which signals that some deals are falling apart before closing, often due to inspection issues, financing problems, or the buyer's second thoughts. It's a reminder that getting under contract is only part of the process—solid preparation and realistic expectations are crucial to reaching the finish line.
⬇️ SALE PRICE/LIST PRICE RATIO: 98.25%, down from 98.54% 📈
Though the change is small, it suggests buyers are finding more opportunities to negotiate, particularly on homes that require repairs, updates, or were initially priced above market expectations. For sellers, this means that setting a realistic price and presenting the home well are more important than ever to minimize concessions.
💰 Price Analysis:
🏡 Homes Sold Under $499,999: 179 sales
🏘️ Mid-Range Market ($500,000–$999,999): 74 sales
💲 Luxury Market ($1M+): 12 sales
Are you ready to explore your real estate options or have questions about these statistics? Let’s discuss how these numbers can impact your buying or selling strategy!😄 🌟