
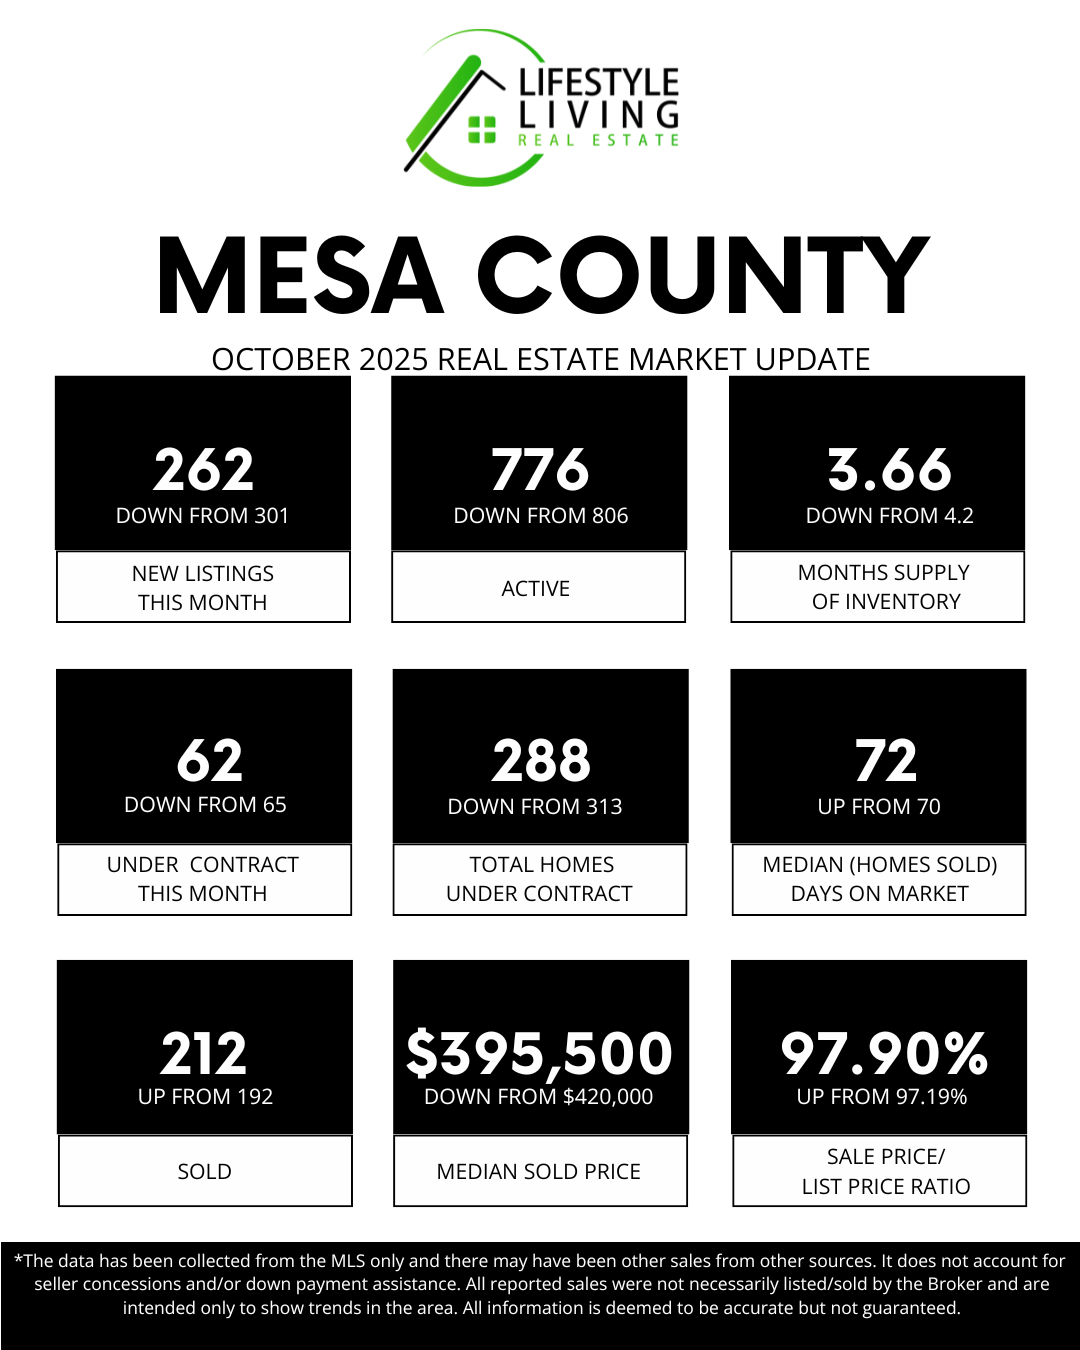
⬇️ NEW LISTINGS IN OCTOBER: 262, down from 301 🏡
Fewer new homes came on the market in October, which is typical as we head into the holiday season. With fewer fresh listings, buyers have slightly less to choose from, and well-priced homes stand out even more.
⬇️ TOTAL ACTIVE HOMES: 776, down from 806 📊
Overall inventory dipped this month, signaling a seasonal tightening in housing supply. While we are still ahead of last year’s levels — when only 669 homes were available — buyers may notice less selection compared to late summer. This slight pullback in active listings reinforces the importance of pricing and presentation as we move into the winter market.
⬇️ MONTHS SUPPLY OF INVENTORY: 3.66, down from 4.2 📈
The supply of available homes moved further away from a balanced 4–7 month range, leaning back toward a seller-advantaged market. This suggests demand remains steady enough to absorb inventory even as new listings slow.
⬇️ UNDER CONTRACT IN OCTOBER: 62, down from 65 📜
Buyer activity softened slightly, which is common this time of year as holidays approach and families shift focus. Serious buyers are still in the market — just moving a bit more selectively.
⬇️ TOTAL HOMES UNDER CONTRACT: 288, down from 313 🏠
The decline in homes under contract reflects seasonal slowing and buyer caution. Sellers who price strategically and present their homes well will continue to attract committed buyers.
⬆️ MEDIAN (HOMES SOLD) DAYS ON MARKET: 72, up from 70 ⏳
Homes are taking just a little longer to sell, another sign of a calmer fall market. This gives buyers more breathing room, though desirable homes still move quickly.
⬇️ SOLD IN OCTOBER: 212, up from 192 🪧
Despite slower contract activity, more homes closed in October — indicating contracts written earlier in the fall are now finalizing. This is encouraging momentum as we move into year-end.
⬆️ MEDIAN SOLD PRICE $395,500, down from $420,000 📈
The median sold price declined this month, reflecting a softer pricing environment as we head into the fall and winter season. While prices can fluctuate month to month, this shift is a reminder for sellers to stay competitive on pricing and condition, as today’s buyers are value-focused and patient.
⬇️ SALE PRICE/LIST PRICE RATIO: 97.90%, up from 97.19% 📉
Homes are selling closer to the list price, showing sellers are pricing more accurately and buyers are making realistic offers. This is a sign of a healthy, data-driven market.
💰 SOLD PRICE ANALYSIS:
🏡 Homes Under $499,999: 147 sales
🏘️ Mid-Range Market ($500,000–$999,999): 60 sales
💲 Luxury Market ($1M+): 6 sales
In summary, the Mesa County housing market reflected a typical seasonal slowdown as we moved deeper into fall. New listings and overall active inventory both declined, giving buyers fewer options than earlier in the year. Homes under contract also dipped slightly, and days on market ticked up — signs that buyers are taking a more measured approach. Even so, closings remained strong, and homes continued selling near list price, showing resilience and steady demand. With months of inventory decreasing and prices adjusting, sellers who price strategically and present their homes well are still in a favorable position. At the same time, buyers benefit from a bit more breathing room and negotiating opportunity than we saw during peak summer activity.