
📊SEPTEMBER Market Trends: Your Guide to Local Real Estate🏡
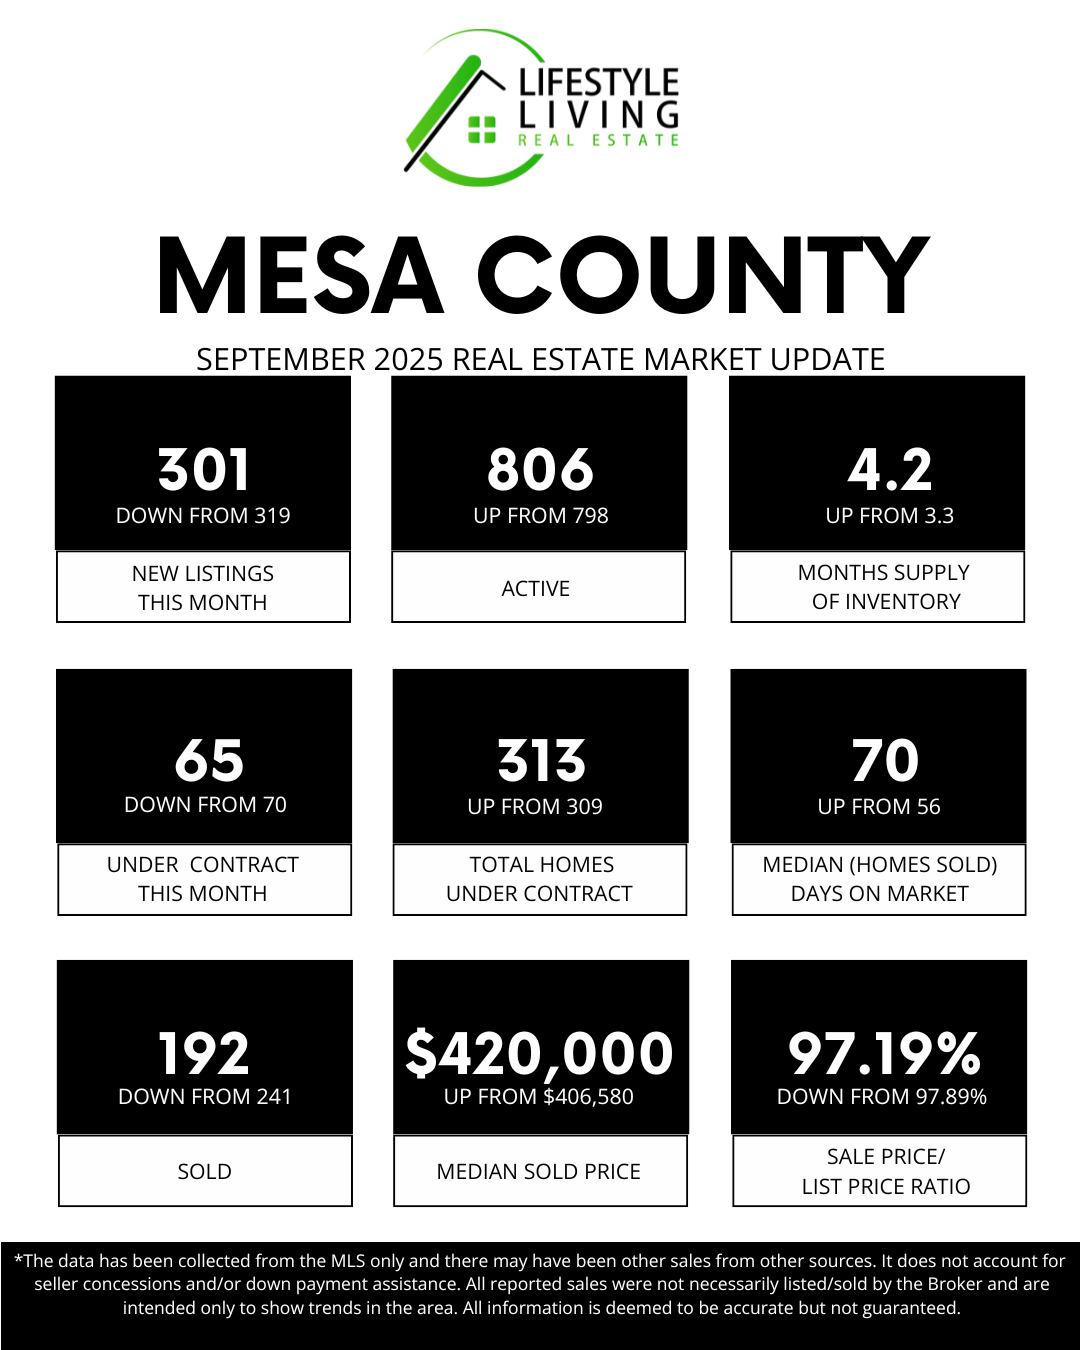
⬇️ NEW LISTINGS IN SEPTEMBER: 301, down from 319 🏡
September saw slightly fewer new listings compared to August. This seasonal slowdown is common as families settle into fall routines. Buyers had fewer fresh options, making well-priced homes stand out even more.
⬆️ TOTAL ACTIVE HOMES: 806, up from 798 📊
Despite fewer new listings, the overall number of active homes increased again. This suggests some properties are taking longer to sell. Buyers benefit from more choices, while sellers may need to sharpen pricing strategies.
⬆️ MONTHS SUPPLY OF INVENTORY: 4.2, up from 3.3 📈
Inventory supply jumped in September, moving the market closer to balance. A 4–6 month supply typically indicates a neutral market, where neither side has a significant advantage. This shift gives buyers more room to negotiate.
⬇️ UNDER CONTRACT IN SEPTEMBER: 65, down from 70 📜
Fewer buyers went under contract compared to last month. This shows a slight dip in new buyer activity. Even so, serious buyers are still writing offers when they find the right fit.
⬇️ TOTAL HOMES UNDER CONTRACT: 313, up from 309 🏠
The total number of homes under contract increased, despite fewer new contracts being signed. This means more transactions are still in progress. It reflects steady demand despite seasonal slowdowns.
⬆️ MEDIAN (HOMES SOLD) DAYS ON MARKET: 70, up from 56 ⏳
Homes sold in September took longer to go under contract compared to August. Rising days on market suggest buyers have more time to make decisions. Sellers should prepare for slightly longer timelines.
⬇️ SOLD IN SEPTEMBER: 192, down from 241 🪧
Closed sales fell more noticeably in September. This aligns with the dip in contracts earlier in the summer. It’s a reminder that closings often trail buyer activity by several weeks.
⬆️ MEDIAN SOLD PRICE $420,000, up from $406,580 📈
The median sold price rose in September, despite a decrease in sales volume. This indicates that well-presented homes continue to command strong values. Buyers are selective, but they’re willing to pay for quality.
⬇️ SALE PRICE/LIST PRICE RATIO: 97.19%, down from 97.89% 📉
Sellers received a slightly smaller percentage of their asking price compared to August. This signals more negotiation power for buyers. Correct pricing from the start is key to securing stronger offers.
💰 SOLD PRICE ANALYSIS:
🏡 Homes Under $499,999: 128 sales
🏘️ Mid-Range Market ($500,000–$999,999): 58 sales
💲 Luxury Market ($1M+): 6 sales
September’s market shows a shift toward more balance, with inventory climbing to 4.2 months and homes taking longer to sell. Although overall sales volume decreased, prices remained steady, with the median sold price rising to $420,000. The bulk of activity remains in the more affordable range, with 128 homes selling for under $499,999, 58 sales in the mid-range between $500,000 and $999,999, and 6 homes closing in the $1M+ luxury market. This mix highlights that while buyers have more time and leverage, well-positioned homes across all price points continue to move.
Are you ready to explore your real estate options or have questions about these statistics? Let’s discuss how these numbers can impact your buying or selling strategy!😄 🌟